My Time with Weather Underground (and Some Favorite Posts)

Above: Your author watches a stunning sunset over the Teton Mountain Range in Wyoming following a thunderstorm that left a shelf of mammatus clouds in its wake. (Jim Pire)
In the early summer of 2010, Dr. Perry Samson (meteorology professor at the University of Michigan (UM) in Ann Arbor and co-founder of Weather Underground) approached me with the proposition to begin blogging for Weather Underground as a result of my book Extreme Weather: A Guide and Record Book, which he was using as an ancillary text for some of the courses he taught at UM. Perry introduced me to WU co-founder Dr. Jeff Masters, who was running the company at the time.
Jeff and I decided that I would become the company’s “weather historian”, and I posted my first blog entry for WU in September 2010. For the first two years I blogged once a week, along with Jeff and Ricky Rood. Then, in late 2012 I picked up the pace and began posting three times weekly. This continued for the next few years until the end of 2014, when Bob Henson joined WU and took on the primary blogging responsibilities. This was a relief for me since I was finding it increasingly difficult to pen three blogs a week on historical weather events. Since then I gradually reduced my blogging from once a week to once a month, my pace for the past four years.
All in all, I posted around 400 blogs for WU. As Category 6 is now winding down (see the announcement post from June 10), this final post of mine consists of some of what I consider to have been my most interesting blogs over the course of the ten years I worked for Weather Underground.
My fourth blog entry for WU, posted in October 2010, was probably the most influential:
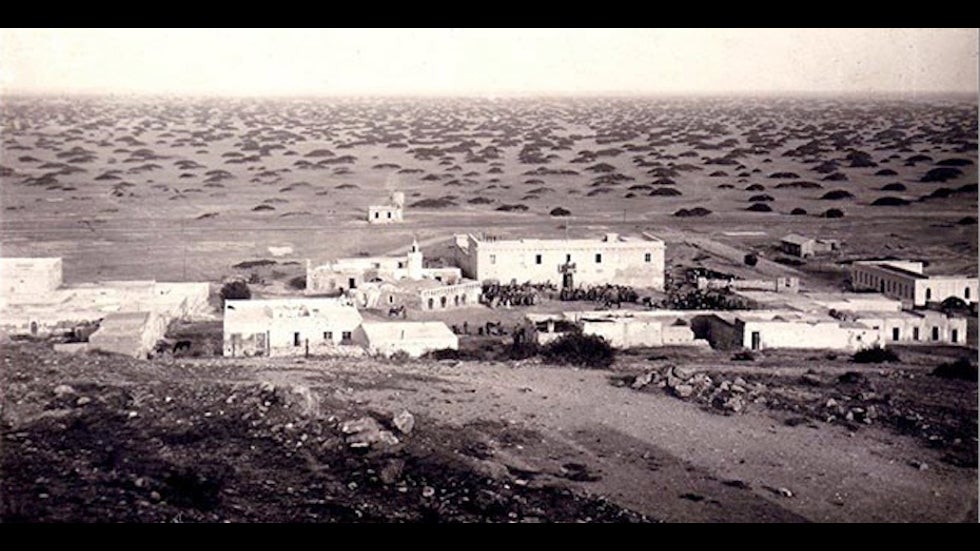
Questions Concerning the World Record 136.4°F (58°C) at Al Azizia, Libya
The images for this entry have been lost (sorry!). The post led to an official investigation of the record by the World Meteorological Organization. I was invited to be a member of this committee, along with a dozen other climatologists from around the world. The investigation resulted in the record being officially overturned. The full committee report was simultaneously published in a BAMS article in February 2013. I blogged on this report (with images saved this time) in September 2012, when the WMO made its official proclamation. The story even made the front page of the New York Times on December 29, 2012—my Andy Warhol “fifteen minutes of fame”!
Weather Underground produced a feature documentary, “Dead Heat”, concerning the two-year long investigation. The documentary is actually more exciting than you might think. It was a professional production and covered not just one but two Libyan revolutions which had a part in the WMO investigation. In February 2011 Khalid El-Fadli, who was the director of Libya’s meteorological service and a key member of the investigation, went missing for six-plus months. ”Dead Heat” is 25 minutes long, but worth the effort to view. It’s also the only feature documentary Weather Underground ever produced (we filmed in March-May 2012). At the end of the film I visit Death Valley, which by default became the new record-holder for hottest place on Earth.
“Dead Heat” can be viewed online through Vimeo.
In October 2016 I posted a blog entry, co-authored and researched by William Reid, concerning the Death Valley heat record featured in the last 10 minutes of the WU documentary mentioned above. Although I had concluded in “Dead Heat” that the Death Valley record from 1913 was most likely valid, I later reconsidered that verdict.
An Investigation of Death Valley’s 134°F World Temperature Record
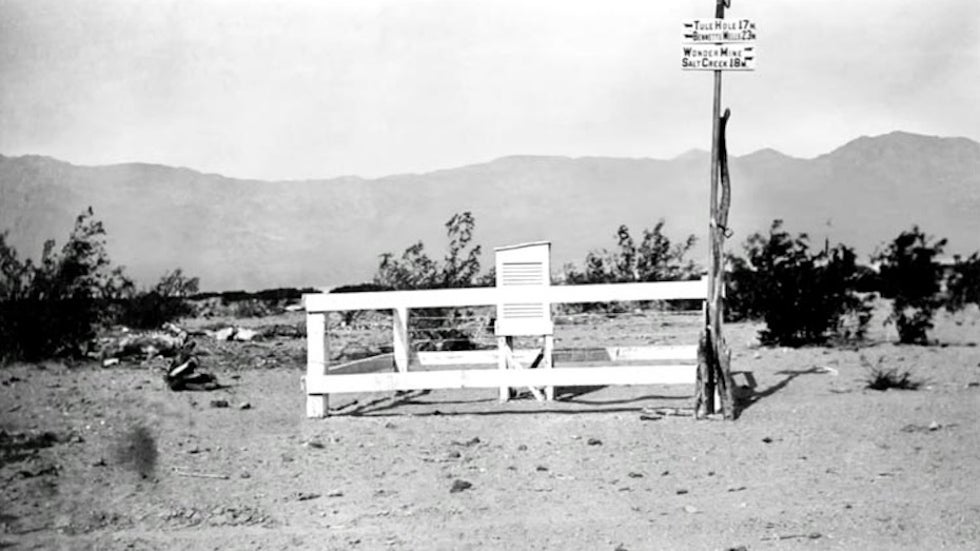
As you can read in that 2016 entry, it was not meteorologically possible for the temperature to have reached 134°F (56.7°C) at the Greenland Ranch (now Furnace Creek) on July 13, 1913.
The WMO is unwilling to revisit this old record, since they normally do not rehash old weather records (the Libyan investigation was unique). The WMO also feared going down a rabbit hole of investigating what the actual world heat record might be, since there are a number of would-be contenders. See, for instance, this entry I posted in July 2016 on the hottest temperature reports from around the world.
Hottest Reliably Measured Air Temperatures on Earth
As you can read, William and I conclude with certainty that the actual hottest temperature ever reliably measured on Earth is 54°C (129.2°F), shared by Death Valley on June 30, 2013 and Mitribah, Kuwait on July 21, 2016. By the way, following this further investigation I now give the claimed Death Valley 1913 record a validity score of 0. You’ll have to read the blog to understand what that means.
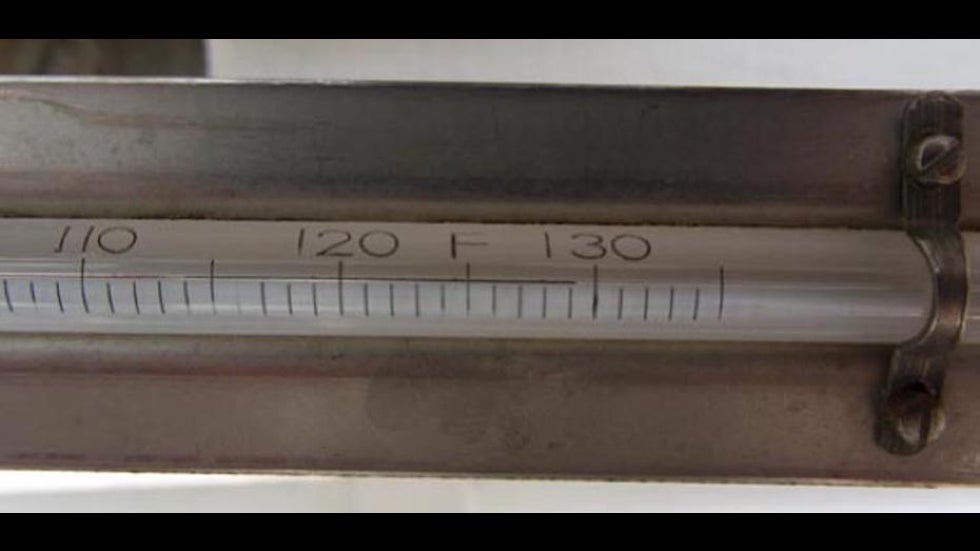
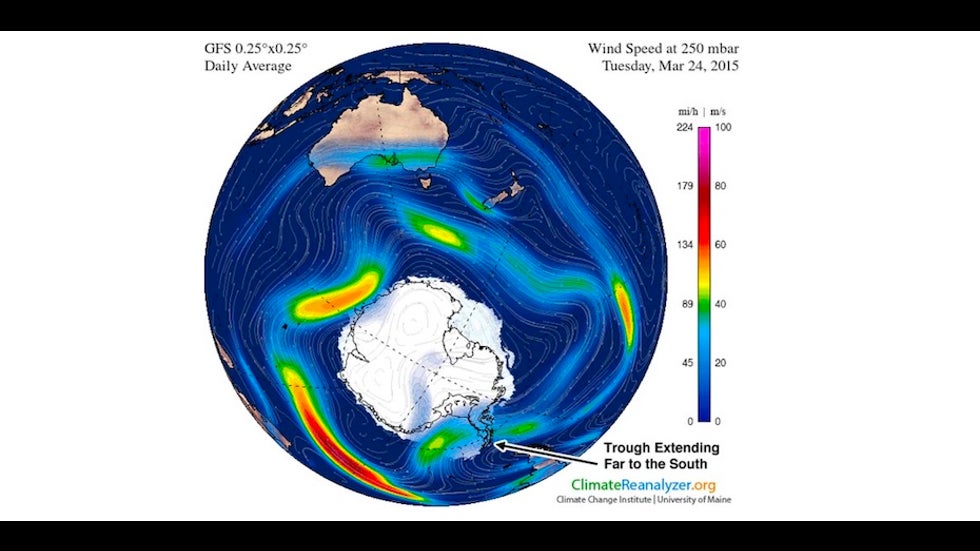
Another entry of mine, posted in March 2015, did result in a new WMO investigation: the warmest temperature ever measured in Antarctica.
Possible New Continental Heat Record for Antarctica
The value of 17.5°C (63.5°F) was accepted by the WMO in 2015, although this record was broken again in February 2020.
Yet another blog entry of mine, posted in March 2013, also resulted in a WMO investigation concerning what might be the wettest place on Earth. Across 31 complete years of data, the annual average precipitation at Puerto Lopez, Colombia, was an astonishing 13,466.3 mm (530.17”).
New Wettest Place on Earth Discovered?
In this case the WMO came to the conclusion that there were a few too many months of precipitation data missing over the latest 30-year period of record (1981–2010) for Puerto Lopez, to be determined as officially the wettest location on Earth. Regardless of that, there is no question in my mind that Puerto Lopez is, in fact, the wettest location on Earth for which long-term data exists.
Along the lines of wettest locations around the world is the discovery of a site in Maui, Hawaii, that is likely the wettest location in North America. See this entry I posted in May 2012:
New Wettest Location for the U.S.A. Discovered?
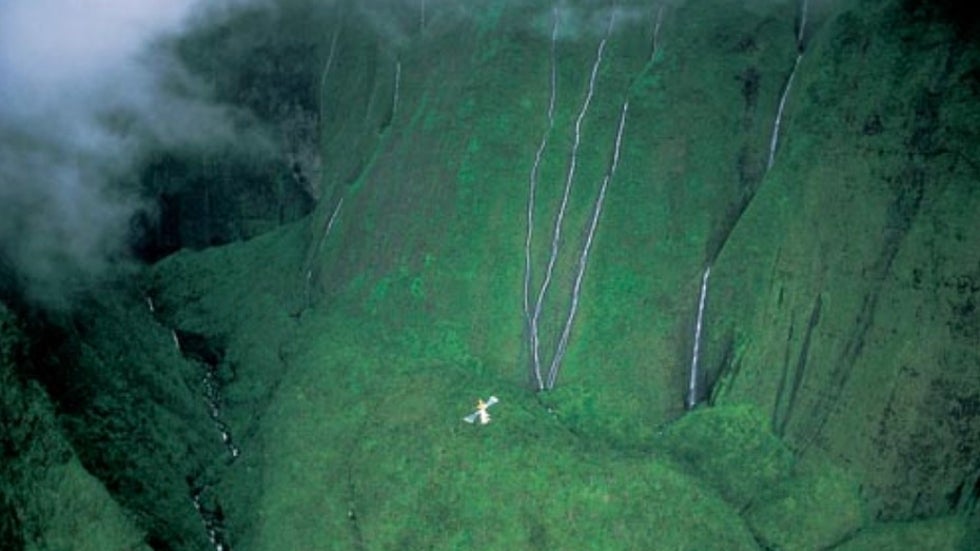
Big Bog on Maui appears to be even wetter than Mt. Waialeale on Kauai according to research done by a team of scientists from the University of Hawai'i at Mānoa.
Time to Update World’s Driest and Wettest Locations?
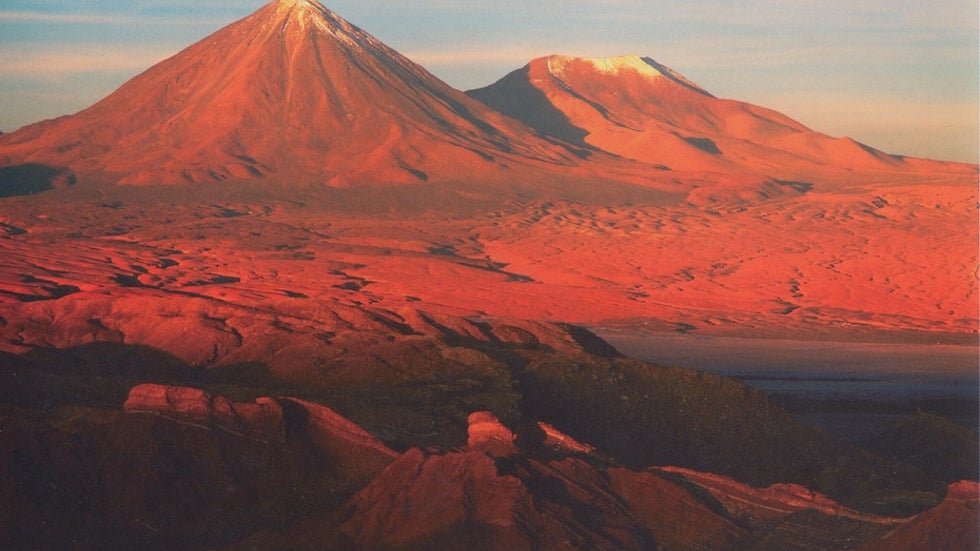
It is apparent that Quillagua, Chile (POR since 1964) is even drier than Arica, Chile, which is still, perhaps erroneously, listed by the WMO as the driest place on Earth.
Another likely world record I blogged about was that of the most rain to fall in a 1-minute period. This entry, posted in September 2013, uncovered an obscure paper published by a French government agency that detailed the event that occurred near Barot, Guadeloupe, on November 26, 1970.
World’s Greatest 1-Minute Precipitation Record
The evidence presented in this report for the a 1-minute rainfall of 1.50” is just as detailed as the evidence for Unionville, Maryland’s 1-minute record (1.23” in 1-minute on July 4, 1956) which is considered the world record for such.
On the subject of world weather records, I’ve always been intrigued in barometric records. I posted a two-part entry in November 2011 on the highest and lowest barometric pressure records (reduced to sea level) measured in the U.S. and on Earth.
World and U.S. Lowest Barometric Pressure Records
World and U.S. Anti-Cyclonic (High Barometric) Pressure Records
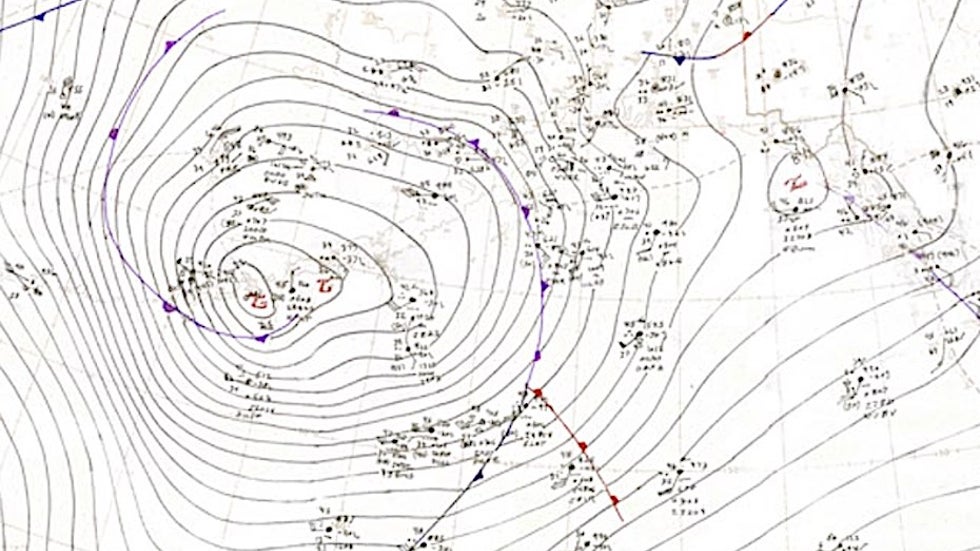
It should be noted that the WMO investigated the Mongolian high-pressure record(s) and disallowed them due to the high elevation of the site.
More recently (since a I began blogging just once a month and had more time for research) I posted several analyses of historical U.S. temperature, precipitation, and snowfall trends. These posts employed weeks of research. I used only sites with very long PORs, which differs from other similar analysis that incorporated more sites but shorter PORs.
Posted in May 2017:
U.S. Daily Record Highs Outnumber Lows 5 to 1 since 2010
I was planning to update this data at the beginning of 2021 to see how the full decade of 2010-2019 eventually turns out. Alas, not to be.
Along the same line is this entry posted a bit later in October 2017 concerning the dramatic increase in average annual temperatures for cities across the U.S.:
A Dramatic Increase in Annual Average Temperatures for U.S. Cities This Decade
Once again, I was planning to update this blog early next year (2021) when the new 30-year POR temperature data for the entire 1991-2020 POR becomes available.
This year I posted two blogs (the snow one in January and the precipitation one in March) concerning decadal trends of snowfall and precipitation for a select but representative number of cities across the contiguous U.S. with POR’s dating back to at least 1900.
U.S. Snowfall 1900-2019: A Decade-by Decade Look
U.S. Precipitation 1901-2019: A Decade-by-Decade Look
There are some interesting conclusions, but they vary from considerably from one region to the next. Please view the posts for the details.
Another two-part entry, in October-November 2018, concerned what I considered some of the most anomalous weather events in U.S. history. This, of course, is a subjective list.
The Most Anomalous Weather Events in U.S. History (Part 1)
The Most Anomalous Weather Events in U.S. History (Part 2)
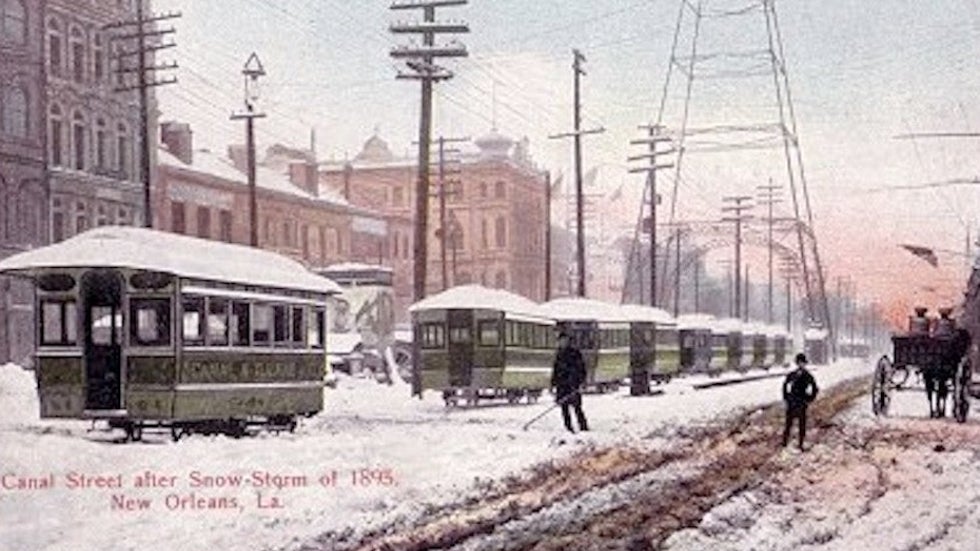
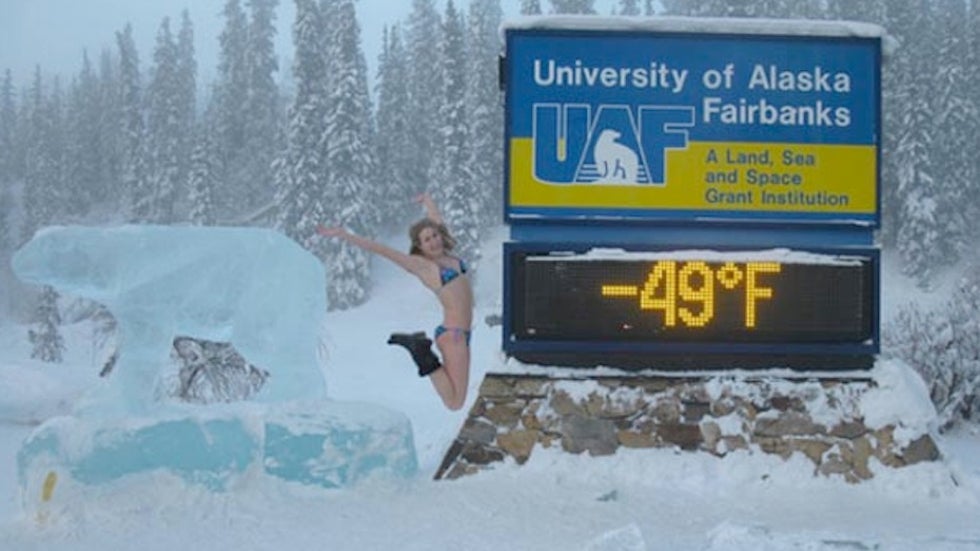
Last but not least, a fun entry from 2012:
The Top 12 Most Unusual Weather-Related Photographs
KUDOS: As they say, all good things must come to an end, and so it is with sadness I say farewell to Weather Underground. I want to thank Perry Samson for introducing me to Weather Underground, Jeff Masters for hiring me as WU’s “weather Historian”, and Bob Henson for carrying the torch and being the best editor I ever had the pleasure to work with. Also, huge thanks to Maximilliano Herrera, who brought much of the information posted in my blogs to my attention including many mentioned above.
Signing out,
Christopher C. Burt
Weather Historian
The views of the author are his/her own and do not necessarily represent the position of The Weather Company or its parent, IBM.