June 2019: Earth's Hottest June on Record

Above: In this picture taken on June 6, 2019, Hindu priests sit inside large vessels filled with water as they perform the 'Parjanya Japa' and offer prayers to appease the rain god for timely monsoons at the Huligamma Devi Temple in Koppal District, some 300 km from Bangalore, India. A 33-year-old man died after a fight over water in southern India, police said on June 7, as huge parts of the country gasped from drought and a brutal summer heatwave. The heat wave was blamed for 210 deaths in June, making it Earth’s deadliest weather-related disaster of the month. Image credit: STR/AFP/Getty Images.
June 2019 was the planet's warmest June since record keeping began in 1880, said NOAA's National Centers for Environmental Information (NCEI) on Tuesday. NASA also rated June 2019 as the warmest June on record, well of ahead of the previous record set in 2015.
The global heat in June is especially impressive and significant given that only a weak (and weakening) El Niño event was in place. As human-produced greenhouse gases continue to heat up our planet, most global heat records are set during El Niño periods, because the warm waters that spread upward and eastward across the surface of the tropical Pacific during El Niño transfer heat from the ocean to the atmosphere.
Global ocean temperatures during June 2019 were tied with 2016 for warmest on record, according to NOAA, and global land temperatures were the warmest on record. Global satellite-measured temperatures in June 2019 for the lowest 8 km of the atmosphere were the warmest or second warmest in the 41-year record, according to RSS and the University of Alabama Huntsville (UAH), respectively.
As of July 15, July 2019 was on track to be the warmest month in Earth’s history (in absolute terms, not in terms of temperature departure from average)--just ahead of the record set in July 2017.
A 5% chance 2019 will be the warmest year in Earth’s recorded history
The January through June year-to-date period was tied with 2017 for second warmest global temperatures on record, behind 2016. According to NCEI's global annual temperature ranking outlook, it is virtually certain that 2019 will end among the top five warmest years in Earth’s history. This means that the six warmest years on record globally since 1880 will be the last six years--2014 through 2019. Climate scientist Gavin Schmidt of NASA gives a 5% chance that 2019 will beat 2016 as Earth’s warmest year on record.
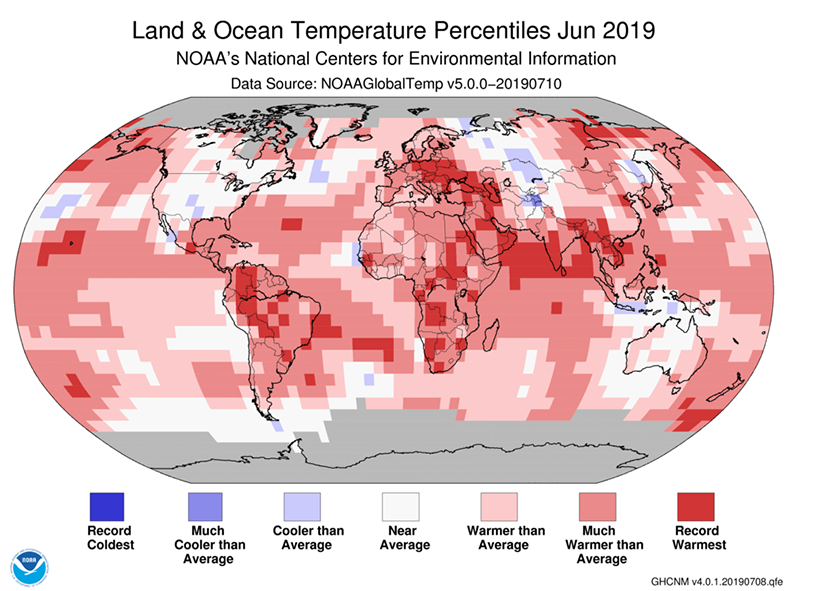
Greatest June heat wave in European history
June 26 – 30, 2019 brought the greatest June heat wave in European history. Hundreds of stations with a long-term period of record (POR) set their all-time June maximum temperature records, and all-time heat records for any month were set in two nations—France, and Andorra. In addition, all-time heat records fell at 84 stations with long-term PORs in eleven nations—Germany, France, Switzerland, Austria, Poland, Italy, Liechtenstein, Andorra, Spain, Denmark, and the Czech Republic.
A rapid-response climate change attribution study done on the heat wave by scientists with the World Weather Attribution website found that for France, human-caused climate change made the heat wave at least five times more likely to occur, with observations indicating that climate change might have made the heat wave more than 100 times more likely to occur. One of the scientists involved said, “We could however not say more from models and observations because (i) it is so extreme that statistics reach their limits and (ii) models are not accurate enough.” World Weather Atrribution is an international effort by leading climate scientists to analyze and report on climate-change-related aspects of major weather events on a time scale of weeks to months, while the events are still fresh in mind. By design, such reports are preliminary, but they are conducted by the same scientists who carry out more comprehensive published peer-reviewed studies, using many of the same tools.
Three billion-dollar weather disasters in June 2019
Three billion-dollar weather-related disasters hit the Earth last month, according to the June 2019 Catastrophe Report from insurance broker Aon: a severe weather outbreak in Europe ($1.1 billion), flooding in China ($9+ billion, including losses up until July 16), and a drought in India ($1.75 billion). In addition, severe weather outbreaks in the U.S. in late May and mid-March accumulated more than $1 billion in losses by the end of June, bringing the 2019 tally of billion-dollar weather disasters to fourteen:
- Flooding, China, 6/1 – 7/15, $9+ billion, 200 killed
- Flooding, Iran, 3/17 - 4/9, $8.3 billion, 77 killed
- Flooding, Central and Eastern U.S., 3/12 – 7/1, $7 billion, 3 killed
- Severe Weather, Rockies, Plains, Midwest, Southeast U.S., 5/26 – 5/31, $2.75 billion, 3 killed
- Flooding, Argentina, Uruguay, 1/1 - 1/20, $2.3 billion, 5 killed
- Cyclone Fani, India, Bangladesh, 5/3 – 5/5, $2+ billion, 89 killed
- Cyclone Idai, Mozambiqe, Zimbabwe, Malawi, 3/3 - 3/18, $2 billion, 1007+ killed
- Flooding, Australia, 1/28 - 2/7, $1.9 billion, 3 killed
- Drought, India, 1/1 – now, $1.75 billion, 0 killed
- Severe Weather, Plains, Midwest U.S., 3/23 – 3/25, $1.5 billion, 0 killed
- Windstorm Eberhard, Central & Western Europe, 3/10, $1.5 billion, 2 killed
- Severe Weather, Central/Eastern U.S., 2/22 - 2/26, $1.4 billion, 4 killed
- Severe Weather, Central Europe, 6/10 – 6/12, $1.1 billion, 0 killed
- Severe Weather, Plains, Midwest, Southeast U.S., 3/12 – 3/17, $1 billion, 5 killed



El Niño weakens
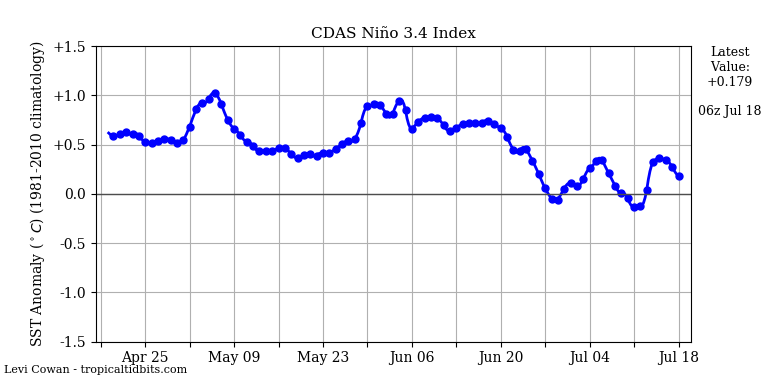
On July 11, NOAA continued its El Niño Advisory, but noted the weak El Niño event that began in January was growing weaker, with El Niño expected to end by September. “A transition from El Niño to ENSO-neutral is expected in the next month or two, with ENSO-neutral most likely to continue through Northern Hemisphere fall and winter,” they predicted. The Japan Meteorological Agency said in their July 10 outlook that the El Niño event “is likely to have ended."
SSTs in the Niño3.4 region—the one that’s most often used to diagnose El Niño and La Niña—must be at least 0.5°C above average for five overlapping three-month periods for an official El Niño event to be ordained. Beginning in late June and continuing through the first half of July, SSTs in the Niño3.4 region fell below the 0.5°C above average threshold, potentially signaling the end of the 2019 El Niño event. The atmospheric response over the past month has been characteristic of what we expect to see in a weakening El Niño event, NOAA said.
Among the latest predictions from a large number of statistical and dynamical El Niño models for the peak of the Atlantic hurricane season in August-October, about 1/2 of the models called for neutral conditions, 1/2 called for El Niño conditions, and none predicted La Niña conditions. If El Niño conditions are not present this fall, this would favor a more active Atlantic hurricane season, since El Niño conditions tend to cause an increase in the upper-level winds over the tropical Atlantic that can tear storms apart (higher vertical wind shear).
June Arctic sea ice extent the second lowest on record
Arctic sea ice extent during June 2019 was the second lowest in the 40-year satellite record, behind the record set in June 2016, according to the National Snow and Ice Data Center (NSIDC). Fair weather, high pressure and clear skies dominated much of the Arctic in June. Persistent high pressure over the North American side of the Arctic, combined with low pressure over the Eurasian side, drew in warm air from the south into the Arctic. This circulation pattern resembled the Arctic Dipole pattern that is known to favor summer sea ice loss. This pattern was particularly well developed through the summer of 2007, leading to the second-lowest Arctic sea ice extent on record.
During the first half of July 2019, Arctic sea ice extent was near or below the record-low levels observed during the summer of 2012—the year that ended up with the lowest sea ice extent on record. Record-low values were still in place as of July 17. With low pressure and cloudier skies predicted to dominate the Arctic during the coming week, though, 2012 may once again be the record-holder for lowest Arctic sea ice extent by the beginning of August. In their July 16 update, NSIDC said, “projections suggest that a new record low extent is unlikely this year."
Antarctic sea ice extent during June 2019 was the lowest in the 40-year satellite record, surpassing 2002 and 2017.
Notable global heat and cold marks for June 2019
Hottest temperature in the Northern Hemisphere: 51.4°C (124.5°F) Mitribah, Kuwait, 10 June
Coldest temperature in the Northern Hemisphere: -33.3°C (-27.9°F) at Geo Summit, Greenland, 3 June
Hottest temperature in the Southern Hemisphere: 39.8°C (103.6°F) at Walvis Bay, Namibia, 8 June
Coldest temperature in the Southern Hemisphere: -82.7°C (-116.9°F) at Dome A, Antarctica, 15 June
(Courtesy of Maximiliano Herrera.)
Major weather stations that set (not tied) all-time heat or cold records in June 2019
Among global stations with a period of record of at least 40 years, a remarkable 104 set new all-time heat records in June; there were no stations that set all-time cold records:
Churu (India) max. 50.8°C, 1 June
Pilani (India) max. 47.6 °C, 1 June beaten again to 48.1°C on 10 June
Sagar (India) max. 47.0°C, 3 June
San Jose (Philippines) max. 39.2°C, 3 June
Malanjkhand (India) max. 45.6°C, 5 June
Bramhapuri (India) max. 48.1°C, 6 June
Hoshangabad (India) max. 47.7°C, 6 June
Jhansi (India) max. 48.1°C, 10 June
Nowgong (India) max. 49.0°C, 10 June
Banda (India) max. 49.2°C, 10 June
Sawai (India) max. 49.3°C, 10 June
Ghat (Libya) max. 46.0°C, 16 June
Tuong Duong (Vietnam) max. 42.8°C, 22 June
Con Cuong (Vietnam) max. 43.2°C, 22 June
Calama (Chile) max. 32.1°C, 23 June
Isabel Rubio (Cuba) max. 36.6°C, 24 June
Lhasa (China) max. 30.8°C, 24 June
Alpinzentrum Rudolfshuette (Austria) max. 21.8°C, 26 June
Prutz (Austria) max. 36.4°C, 26 June
Seefeld (Austria) max. 32.7°C, 26 June
Schrocken (Austria) max. 31.7°C, 26 June
Schmittenhohe (Austria) max. 25.0°C, 26 June
Rottweil (Germany) max. 36.0°C, 26 June
Greiswalder Oie (Germany) max. 32.3°C, 26 June
Clermont Ferrand (France) max. 40.9°C, 26 June
Saentis (Switzerland) max. 21.0°C, 26 June
Corvatsch (Switzerland) max. 13.3°C, 26 June
Davos (Switzerland) max. 29.8°C, 26 June
Scuol (Switzerland) max. 33.3°C, 26 June
San Bernardino (Switzerland) max. 29.4°C, 26 June
Buffalora (Switzerland) max. 28.1°C, 26 June
Piotta (Switzerland) max. 35.4°C, 27 June
Montana (Switzerland) max. 31.0°C, 27 June
Cimetta (Switzerland) max. 29.7°C, 27 June
Robbia (Switzerland) max. 34.3°C, 27 June
Koppigen (Switzerland) max. 36.5°C, 27 June
Disentis (Switzerland) max. 33.3°C, 27 June
Santa Maria (Switzerland) max. 31.7°C, 27 June
Grachen (Switzerland) max. 30.6°C, 27 June
La Rochelle (France) max. 40.5°C, 27 June
Aurillac (France) max. 38.1°C, 27 June
La Roche sur Yon (France) max. 38.8°C, 27 June
Mende (France) max. 37.1°C, 27 June
Aosta (Italy) max. 40.4°C, 27 June
Mondovi (Italy) max. 40.2°C,27 June
Bolzano (Italy) max. 40.0°C, 27 June
Yenbo (Saudi Arabia) max. 49.6°C, 28 June
Gallargues le Montueux (France) max. 45.9°C, 28 June
Villevieille (France) max. 45.4°C, 28 June
Nimes (France) max. 44.4°C, 28 June
Carpentras (France) max. 44.3°C, 28 June
Istres (France) max. 44.3°C, 28 June
Montpellier (France) max. 43.5°C, 28 June
Salon de Provence (France) max. 43.4°C, 28 June
Arles (France) max. 42.8°C, 28 June
St Auban sur Durance (France) max. 42.2°C, 28 June
Sete (France) max. 40.3°C, 28 June
Perpignan (France) max. 42.4°C, 28 June
Aix in Provence (France) max. 42.0°C, 28 June
Avignon (France) max. 42.8°C, 28 June
Aigues Mortes (France) max. 40.9°C, 28 June
Barcelonnette (France) max. 36.7°C, 28 June
Mont Aigoual (France) max. 29.9°C, 28 June
Embrun (France) max. 38.4°C, 28 June
Girona (Spain) max. 43.9°C, 28 June
Madrid Retiro Observatory (Spain) max. 40.7°C, 28 June
Borda Vidal (Andorra) max. 39.4°C, 28 June: New national record high for Andorra
Lleida (Spain) max. 43.4°C, 29 June
Calamocha (Spain) max. 39.5°C, 29 June
Navacerrada (Spain) max. 32.0°C, 29 June
Mount Rose (Italy) max. 9.7°C, 29 June
Mount Blanc (Italy) max. 9.3°C, 29 June
Veguitas (Cuba) max. 39.1°C, 30 June: New national record high for Cuba
Tirstrup (Denmark) max. 32.0°C, 30 June
Malbun (Liecthenstein) max. 28.0°C, 30 June
Kucharovice (Czech Republic) max. 38.4°C, 30 June
Mesto Albrechtice-Zary (Czech Republic) max. 35.7°C, 30 June
Swinoujscie (Poland) max. 37.8°C, 30 June
Jelena Gora (Poland) max. 36.0°C, 30 June
Strasbourg Airport (France) max. 38.8°C, 30 June
Krems (Austria) max. 38.5°C, 30 June
Innsbruck (Austria) max. 38.5°C, 30 June
Imst (Austria) max. 37.9°C, 30 June
Bernburg (Germany) max. 39.6°C, 30 June
Frankfurt Airport (Germany) max. 39.3°C, 30 June
Dillenburg (Germany) max. 39.0°C, 30 June
Jena (Germany) max. 38.8°C, 30 June
Geisenheim (Germany) max. 38.7°C, 30 June
Lauchstadt (Germany) max. 38.2°C, 30 June
Leipzig Observatory (Germany) max. 38.3°C,30 June
Berlin Tegel Airport (Germany) max. 38.6°C, 30 June
Berlin Tempelhof Airport (Germany) max. 38.5°C, 30 June
Berlin Schonefeld Airport (Germany) max. 38.4°C, 30 June
Giessen Wettenberg (Germany) max. 38.1°C, 30 June
Neuruppin (Germany) max. 38.0°C, 30 June
Marnitz (Germany) max. 37.1°C, 30 June
Weimar (Germany) max. 36.6°C, 30 June
Greifswald (Germany) max. 36.6°C, 30 June
Waldems (Germany) max. 36.5°C, 30 June
Putbus (Germany) max. 35.8°C, 30 June
Mittenwald Buckelwiesen (Germany) max. 34.2°C, 30 June
Cape Arkona (Germany) max. 33.5°C, 30 June
Kleiner Feldberg (Germany) max. 33.2°C, 30 June
Northway (Alaska, USA) max. 33.3°C, 30 June
(Courtesy of Maximiliano Herrera.)
Eight all-time national/territorial heat records set or tied in 2019
Christmas Island (Australia), 31.6°C (88.9°F), 19 January
Reunion Islands (France), 37.0°C (98.6°F), 25 January
Angola, 41.6°C (106.9°F), 22 March
Togo, 43.5°C (110.3°F), 28 March (later tied on 4 April)
Vietnam, 43.4°C, (110.1°F), 20 April
France, 46.0°C (114.8°F) at Verargues, 28 June
Andorra, 39.4°C (102.9°F) at Borda Vidal, 28 June
Cuba, 39.1°C (102.4°F) at Veguitas (Cuba), 30 June
Additionally, all-time national records were probably set in Gabon, Congo, Uganda, the Ivory Coast, and possibly in Equatorial Guinea in March; possibly in the Maldives and probably in Chad, Cameroon, Gambia, Guinea, Ghana, Mali, Angola, Laos, and Guinea Bissau in April and May; and in the UAE in June. However, persistent data outages that affected the transmission of much of the data from non-developed nations this year have prevented data from being received from a number of nations that experienced unprecedented heat waves, according to researcher Maximiliano Herrera.
No all-time national cold records have been set thus far in 2019. Most nations do not maintain official databases of extreme temperature records, so the national temperature records reported here are in many cases not official. I use as my source for international weather records researcher Maximiliano Herrera, one of the world's top climatologists, who maintains a comprehensive list of extreme temperature records for every nation in the world on his website. If you reproduce this list of extremes, please cite Maximiliano Herrera as the primary source of the weather records.
Sixty-nine monthly national/territorial heat records beaten or tied in 2019 (as of July 17)
January: Micronesia, Paraguay, Angola, Equatorial Guinea, Palau
February: Chile, Marshall Islands, Guyana, United Kingdom, Denmark, Sweden, Netherlands, Belgium, Luxembourg, Andorra, Austria, Hungary, Jersey, Guernsey, Slovakia, San Marino, Slovenia, Angola, Papua New Guinea
March: Australia, Marshall Islands, India, Kenya, Northern Marianas
April: Angola, Togo, French Southern Territories, Mayotte, Taiwan, Kenya, Mauritius
May: Kenya, Indonesia, Niger, French Southern Territories, Syria, Tonga, Laos, Vietnam, Japan, Israel, Cyprus, Turkey
June: India, Tonga, Namibia, Lithuania, Senegal, Qatar,Chile, Loas, Vietnam, Germany, Czech Republic, Poland, Switzerland, Luxembourg, Liechtenstein
July: Iran, Wallis and Futuna, Namibia, Jordan, Israel, Hong Kong
Zero monthly national/territorial cold records beaten or tied in 2019 (as of July 17)
No monthly national cold records have been beaten or tied in 2019.
Hemispherical and continental temperature records in 2019
- Highest minimum temperature ever recorded in the Southern Hemisphere: 35.9°C (96.6°F) at Noona, Australia, 18 January. The record was beaten again on 26 January, with a minimum temperature of 36.6°C (97.9°F) recorded at Borrona Downs, Australia. This is also the highest minimum temperature on record for the globe for the month of January.
- Highest temperature ever recorded in the world in March: 48.1°C (118.6°F) on 10 March at Roebourne, Australia.
- Highest temperature ever recorded in Asia in March: 46.9°C (116.4°F) at Kapde, India, 25 March. The data comes from a state (not central government) station, and may not be officially recognized, but is supported by data from several nearby stations.
- Highest minimum temperature ever recorded in June in the Southern Hemisphere: 28.9°C (84.0°F) at Funafuti,Tuvalu on 15 June.
Bob Henson contributed to this post.
The Weather Company’s primary journalistic mission is to report on breaking weather news, the environment and the importance of science to our lives. This story does not necessarily represent the position of our parent company, IBM.