January 2019 Among Earth's Four Warmest Januaries

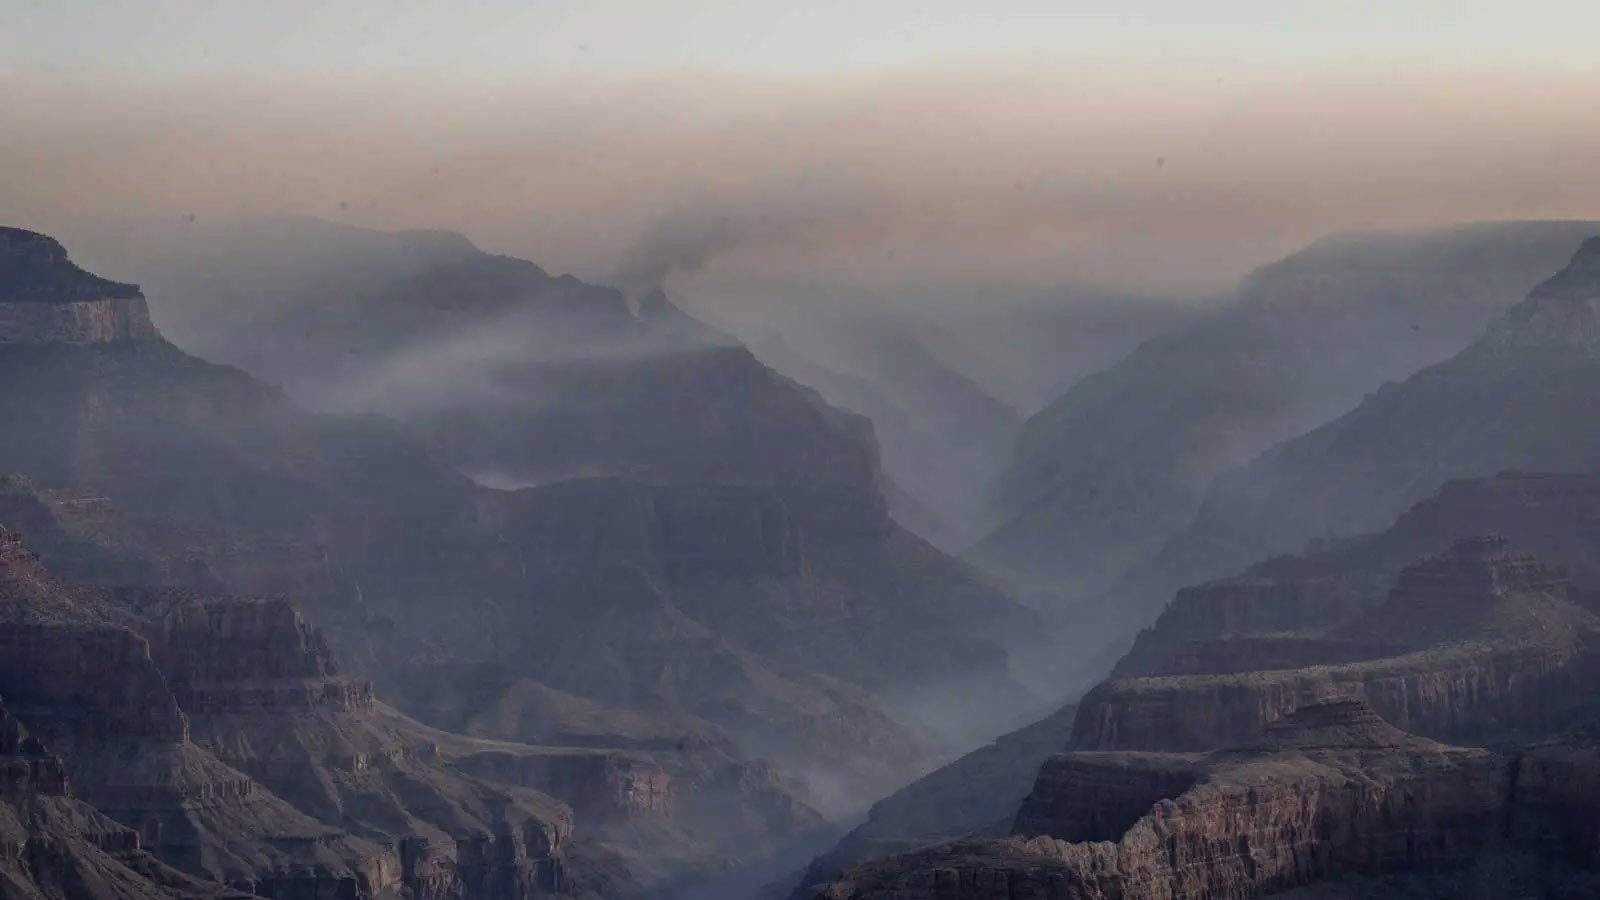
Above: A man cools down in front of a mist fan for relief from the hot weather during the Australian Open tennis tournament in Melbourne on January 25, 2019. January 2019 was the hottest month in Australian recorded history, and tens of thousands of people were left without power on January 25, as the grid struggled with surging demand due to extreme heat. Image credit: Saeed Khan/AFP/Getty Images.
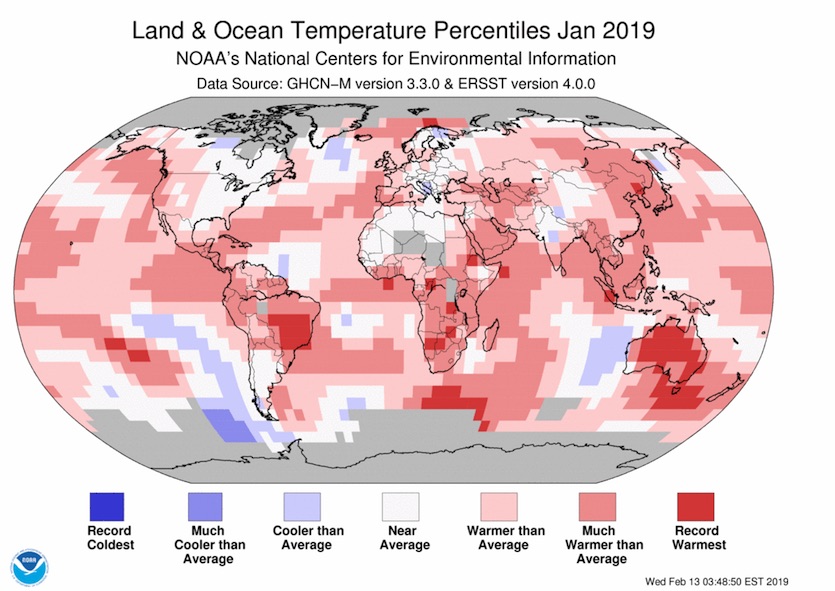
January 2019 was tied with 2007 for the planet's third warmest January since record keeping began in 1880, said NOAA's National Centers for Environmental Information (NCEI) on Tuesday. Taking into account both land and ocean areas, the globally averaged surface temperatures were 0.88°C (1.58°F) above the 20th century average for the month. The only warmer Januaries on record were 2016 and 2017, according to NOAA. Instead of a tie, NASA rated January 2019 as slightly cooler than January 2007, which makes last month the fourth warmest January on record in the NASA database. Minor differences in rankings between NASA and NOAA can arise because of how they handle data-sparse regions such as the Arctic, where few surface weather stations exist.
Global ocean temperatures during January 2019 were the third warmest on record, according to NOAA, and global land temperatures were the fourth warmest on record.
Global satellite-measured temperatures in January 2019 for the lowest 8 km of the atmosphere were the sixth warmest in the 40-year record, according to the University of Alabama Huntsville (UAH) and RSS.
One billion-dollar weather disaster in January 2019
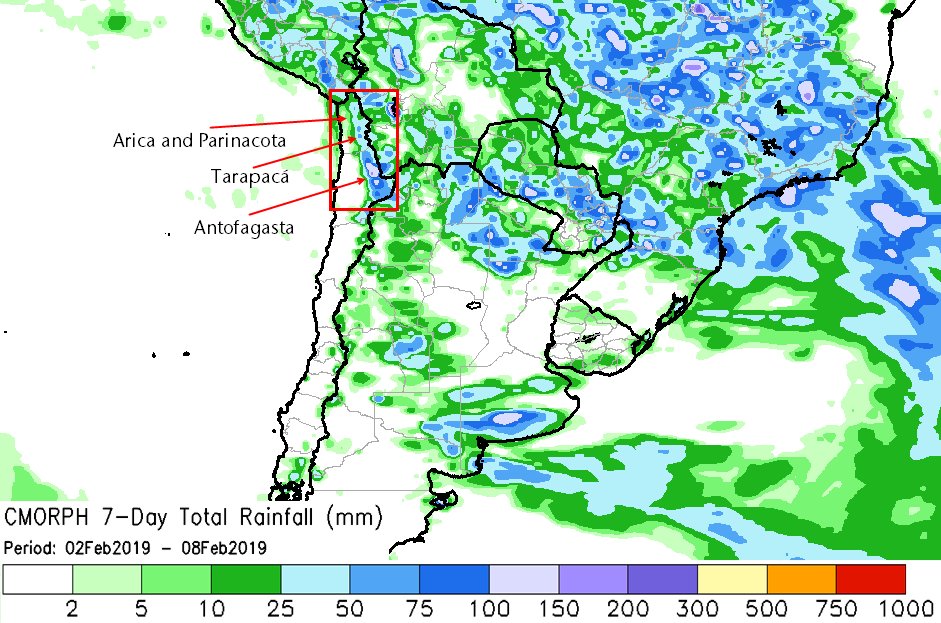
One billion-dollar weather-related disaster hit the Earth last month, according to the January 2019 Catastrophe Report from insurance broker Aon: Flooding in Argentina and surrounding countries that caused $2.3 billion in agricultural damage. The deadliest weather-related disaster of January was flooding in Indonesia’s South Sulawesi that killed 80 people. Here is the tally of billion-dollar weather disasters so far in 2018:
- Flooding, Argentina, Uruguay, Paraguay, and Brazil, 1/1 – 1/20, $2.3 billion, 5 killed
Weak El Niño conditions are in place, NOAA announces
After months of lackluster development, the ocean and atmosphere across the tropical Pacific are finally enough in sync for NOAA to issue an El Niño Advisory. “Weak El Nino conditions are present and are expected to continue through the Northern Hemisphere spring 2019 (~55% chance),” NOAA declared in the advisory, issued on Thursday.
Borderline weak El Niño conditions solidified in January, according to NOAA. Low-level winds across the western Pacific switched from the normal easterly trade winds to westerlies, and westerlies were also in place at upper levels across the eastern Pacific. These El Niño–consistent conditions were accompanied by surface temperatures (SSTs) that remained above average across the central and eastern tropical Pacific, as they’ve been for the last few months.
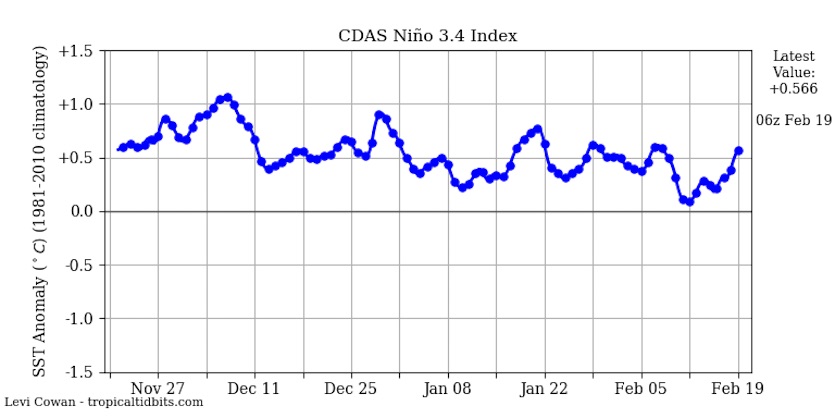
Notably, SSTs in the Niño3.4 region—the one that’s most often used to diagnose El Niño and La Niña—dropped below the standard benchmark for El Niño in January, as the region was less than 0.5°C above the average SSTs for this time of year. To qualify as a full-fledged El Niño episode in the historical record, temperatures in the Niño3.4 region must be at least 0.5°C above average for five overlapping three-month periods. Thus far we've had three such periods (September-November 2018, October-December 2018, and November 2018–January 2019). There is no guarantee that December-February and January-March will make the cut, given that the Niño3.4 anomalies were at or below +0.5°C for much of January and early February. However, on Monday, NOAA's weekly update showed that the Niño3.4 anomaly had risen back to +0.6°C. If such warmth is sustained through March, then the largely borderline conditions of the past few months may yet enter the record books as the El Niño event of 2018-19.
A touch of Modoki
To bolster its verdict that we’re now in El Niño conditions, NOAA emphasized the sustained warmth in the Niño4 region, which sits across a large swath of the central Pacific. The Niño4 region has been warmer than average for the better part of the past year, peaking in October and November.
This type of El Niño set-up, where the central part of the tropical Pacific is the warmest relative to average, was dubbed El Niño Modoki (from the Japanese for “a similar but different thing”) in a landmark 2007 paper. Weaker El Niño events are more likely to be Modoki-style, whereas the most powerful events tend to adhere to the classic prototype, with the warmest waters extending to the far eastern tropical Pacific.
During El Niño Modoki, or what’s also called a Central Pacific El Niño, rising motion tends to be focused further west from North America than in a classic El Niño event. As a result, the repercussions on U.S. weather can also be different, and there may be less of a blunting effect on the Atlantic hurricane season. Many El Niño events fall somewhere in between the classic and Modoki forms, as explained by Michelle L’Heureux (CPC) in a climate.gov post. “Even within the span of a single event, the location of SST anomalies can shift around and take on different flavors,” L’Heureux noted.
Arctic sea ice falls to sixth lowest January extent on record
Arctic sea ice extent during January 2019 was the sixth lowest in the 41-year satellite record, according to the National Snow and Ice Data Center (NSIDC). Arctic temperatures were only slightly above average in January, in contrast to recent Januaries when very warm conditions prevailed. Antarctic sea ice extent in January 2019 was the third lowest on record, behind the records set in 2017 and 2018.
Notable global heat and cold marks for January 2019
Hottest temperature in the Northern Hemisphere: 41.3°C (106.3°F) at Gedaref, Sudan, 27 January
Coldest temperature in the Northern Hemisphere: -60.5°C (-76.9°F) at Geo Summit, Greenland, 14 January
Hottest temperature in the Southern Hemisphere: 49.5°C (121.1°F) at Port Augusta, Australia 24 January
Coldest temperature in the Southern Hemisphere: -47.6°C (-53.7°F) at Concordia, Antarctica, 31 January
(Courtesy of Maximiliano Herrera.)
Major weather stations that set (not tied) new all-time heat or cold records in January 2019
Among global stations with a period of record of at least 40 years, 47 set new all-time heat records in January and 2 set all-time cold records. In addition, Illinois set a preliminary state all-time cold record:
Kulgera (Australia) max. 47.0°C, 3 January
Port Augusta (Australia) max. 48.9°C, 15 January; increased to 49.5°C on 24 January
Tarcoola (Australia) max. 49.0°C, 15 January; increased to 49.1°C on 24 January
Griffith (Australia) max. 46.4°C, 16 January
Albury (Australia) max. 45.3°C, 16 January
Woolbrook (Australia) max. 38.7°C, 16 January
Cooma (Australia) max. 39.5°C, 16 January
Cootamundra (Australia) max. 43.6°C, 17 January
Christmas Island Aero (Australia) max. 31.6°C, 19 January: New territorial record high for Christmas Island
Ceduna (Australia) max. 48.4°C, 23 January; increased to 48.6°C on 24 January
Eucla (Australia) max. 48.6°C, 23 January
Adelaide (Australia) max. 47.7°C, 24 January
Adelaide Airport (Australia) max. 45.8°C, 24 January
Cleve (Australia) max. 46.7°C, 24 January
Port Lincoln Airport (Australia) max. 48.3°C, 24 January
Clare (Australia) max. 44.9°C, 24 January
Snowtown (Australia) max. 47.3°C, 24 January
Parafield (Australia) max. 47.7°C, 24 January
Edinburgh (Australia) max. 47.5°C, 24 January
Roseworthy (Australia) max. 48.3°C, 24 January
Nuriootpa (Australia) max. 46.0°C, 24 January
Kuitpo (Australia) max. 44.0°C, 24 January
Strathalbyn (Australia) max. 46.7°C, 24 January
Deniliquin (Australia) max. 47.2°C, 25 January
Swan Hill (Australia) max. 47.5°C, 25 January
Kerang (Australia) max. 47.0°C, 25 January
Kyabram (Australia) max. 47.1°C, 25 January
Sale (Australia) max. 45.5°C, 25 January
Gobabis (Namibia) max. 41.7°C, 25 January
Pointe des Trois-Bassins (Reunion Islands, France) max. 37.0°C, 25 January: New territorial record high for Reunion Islands
Cilaos (Reunion Islands, France) max. 31.2°C, 26 January
Young (Australia) max. 43.5°C, 26 January
Santiago (Chile) max. 38.3°C, 26 January
Santiago Airport (Chile) max. 39.3°C, 26 January
Tobalaba (Chile) max. 37.4°C, 26 January
Whakatane (New Zealand) max. 33.3°C, 28 January
Kaitaia (New Zealand) max. 31.2°C, 29 January
Hamilton (New Zealand) max. 32.9 °C, 29 January
Wellington Observatory (New Zealand) max. 30.3°C, 29 January
Te Kuiti (New Zealand) max. 33.3°C, 29 January
Taumarunui (New Zealand) max. 34.0°C, 29 January
Levin (New Zealand) max. 32.6°C, 29 January
Upper Hutt (New Zealand) max. 33.5°C, 29 January
Waiau (New Zealand) max. 37.8°C, 31 January
Medbury (New Zealand) max. 37.9°C, 31 January
Lake Tekapo (New Zealand) max. 35.0 °C, 31 January
Hanmer Forest (New Zealand) max. 38.4 °C, 31 January
Rockford (Illinois, United States) min. -35.0°C, 31 January
Moline (Illinois, United States) min. -36.1°C, 31 January
Mount Carroll and Roscoe (Illinois, United States) min. -38.9°C, 31 January: New State record low for Illinois
(Courtesy of Maximiliano Herrera.)
Two all-time national heat records set so far in 2019
Christmas Island (Australia), 31.6°C, 9 January
Reunion Islands (France), 37.0°C, 25 January
No all-time national cold records have been set thus far in 2019. Most nations do not maintain official databases of extreme temperature records, so the national temperature records reported here are in many cases not official. I use as my source for international weather records researcher Maximiliano Herrera, one of the world's top climatologists, who maintains a comprehensive list of extreme temperature records for every nation in the world on his website. If you reproduce this list of extremes, please cite Maximiliano Herrera as the primary source of the weather records.
Two monthly national heat record beaten or tied in 2019
January: Micronesia, Paraguay
No monthly national cold records have been beaten or tied in 2019.
Hemispherical and continental temperature records in 2019
Highest minimum temperature ever recorded in the Southern Hemisphere: 35.9°C at Noona, Australia, 18 January. The record was beaten again on 26 January, with a minimum temperature of 36.6°C recorded at Borrona Downs, Australia. This is also the highest minimum temperature on record for the globe for the month of January.
Bob Henson co-wrote this post.
The Weather Company’s primary journalistic mission is to report on breaking weather news, the environment and the importance of science to our lives. This story does not necessarily represent the position of our parent company, IBM.