Earth Had Its Fifth Warmest November; 2018 a Lock for 4th Warmest Year on Record

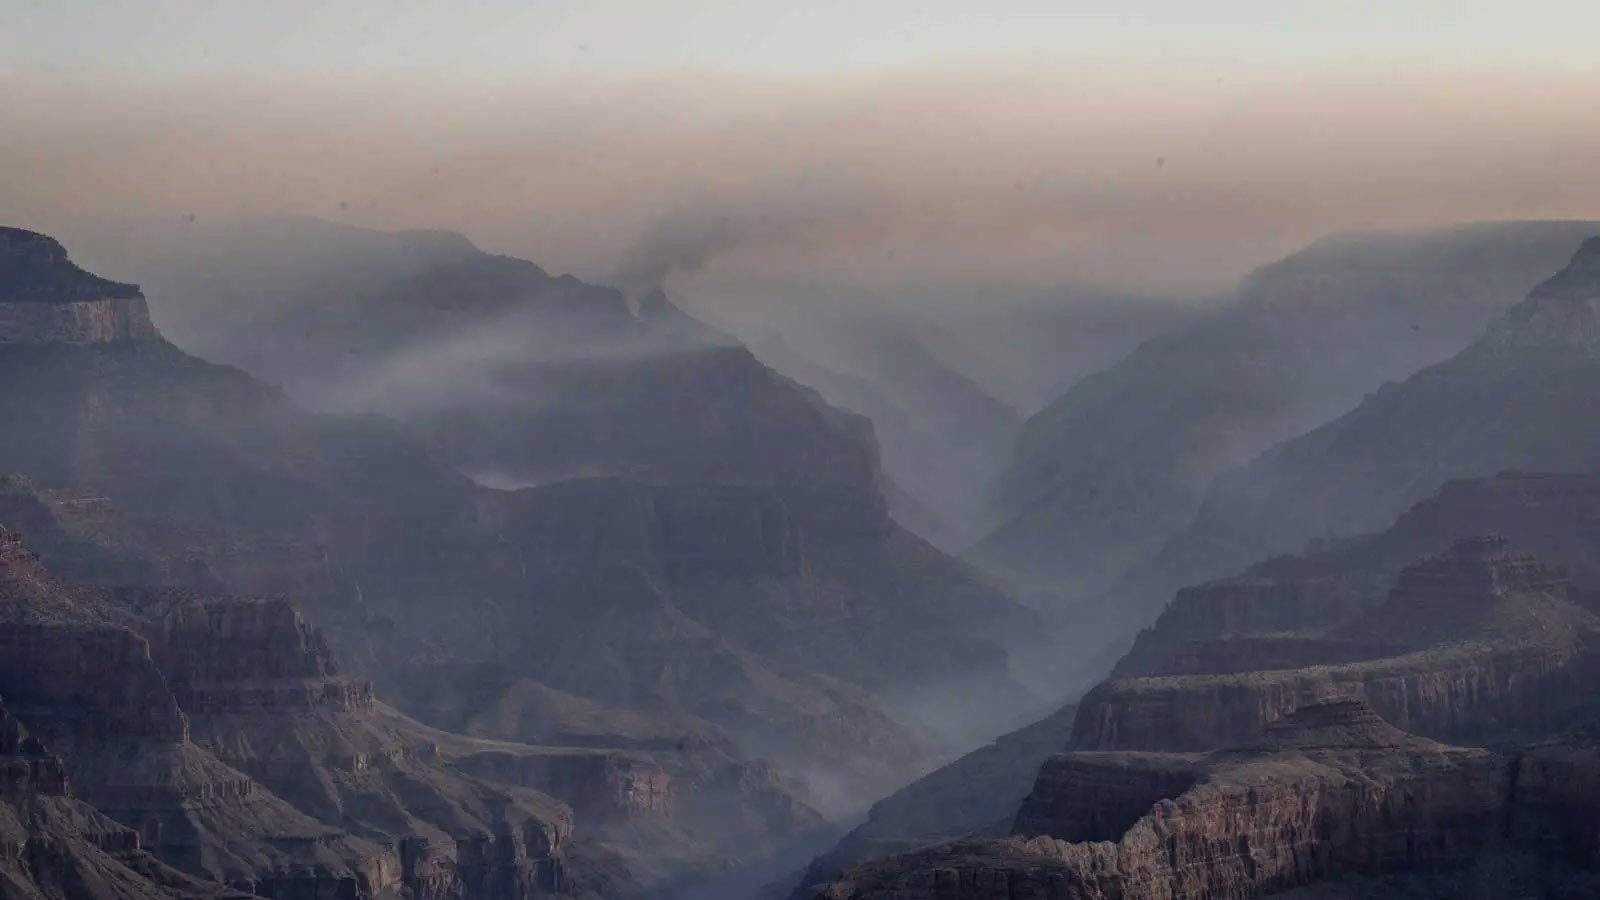
Above: A fallen power line is seen on top of burnt-out vehicles on the side of the road in Paradise, California, after the Camp Fire tore through the area on November 10, 2018. Note the melted metal from the cars puddled on the road. The fire was Earth’s deadliest weather-related disaster of November 2018, with 86 fatalities. Image credit: JOSH EDELSON/AFP/Getty Images.
November 2018 was tied for being the planet's fifth-warmest November since record keeping began in 1880, said NOAA's National Centers for Environmental Information (NCEI) on Tuesday. The only warmer Novembers came in 2015, 2013, 2010, and 2017. NASA also rated November 2018 as tied for fifth-warmest. Minor differences in rankings between NASA and NOAA can arise because of how they handle data-sparse regions such as the Arctic, where few surface weather stations exist.
Global ocean temperatures during November 2018 were the second warmest on record, and land temperatures were the sixteenth warmest on record, according to NOAA. Satellite-measured temperatures for the lowest 8 km of the atmosphere were the fourth warmest in the 40-year record according to the University of Alabama Huntsville (UAH) and RSS.


2018 expected to be the fourth warmest year on record
The year-to-date period of January - November ranked as the fourth warmest such period on record, and 2018 is very likely to be the fourth warmest year on record, NOAA said. This means that the five warmest years on record globally will be the last five years—2014 through 2018. If an El Niño event develops and extends into early 2019, as predicted, it is likely that 2019 will end up even warmer than 2018.
The boreal fall of 2018 ranked as the second warmest September-to-November period on record, globally.
Two billion-dollar weather disasters in November 2018
Two billion-dollar weather-related disasters hit the Earth last month, according to the November 2018 Catastrophe Report from insurance broker Aon: the Camp Fire in northern California, and the Woolsey Fire in southern California. By the end of November, the planet had suffered 37 billion-dollar weather disasters, which ranks as the third highest yearly total since 1990, according to Aon. The only years with more were 2010 and 2013, which both had 41. Here are the billion-dollar weather disasters so far in 2018:
- Hurricane Michael, Southeast U.S., 10/10 – 10/12, $15+ billion, 45 killed
- Hurricane Florence, Southeast, Mid-Atlantic U.S., 9/14 – 9/19, $10-15 billion, 53 killed
- Wildfire, California Camp Fire, 11/8 – 11/25, $10+ billion, 86 killed
- Drought, Northern and Central Europe, 5/1 – 8/31, $7.5 billion, 0 killed
- Flooding, Japan, 7/5 – 7/8, $7 billion, 230 killed
- Flooding, North China, 7/1 – 9/30, $5.75 billion, 50 killed
- Flooding, India, 8/7 – 8/20, $5.5 billion, 500 killed
- Typhoon Rumbia, 8/16 – 8/18, $4.3 billion, 22 killed
- Drought, Argentina and Uruguay, 1/1 – 3/31, $3.9 billion, 0 killed
- Severe Weather, Italy, 10/28 – 11/04, $3.7 billion, 29 killed
- Drought, China, 6/1 – 10/31, $3.55 billion, 0 killed
- Winter Weather, China, 4/2 – 4/18, $3.4 billion, 0 killed
- Drought, U.S., 1/1 – 12/31, $3 billion, 0 killed
- Winter Storm Friederike, Western & Central Europe, 1/18, $2.75 billion, 13 killed
- Severe Weather, Rockies, Plains, Midwest, Northeast U.S., 6/17 – 6/21, $2.4 billion, 3 killed
- Winter Storm Riley, Eastern U.S., 3/1 – 3/3, $2.3 billion, 9 killed
- Typhoon Mangkhut, China, Hong Kong, Philippines, 9/15 – 9/18, $2+ billion, 102 killed
- Typhoon Jebi, Japan, 9/4 – 9/5, $2+ billion, 17 killed
- Wildfire, California Woolsey Fire, 11/8 – 11/21, $2+ billion, 3 killed
- Flooding, South China, Vietnam, 7/1 – 9/30, $2 billion, 38 killed
- Wildfire, California, 8/1 – 8/31, $1.8 billion, 14 killed
- Flooding, China, 5/7 – 7/10, $1.75 billion, 108 killed
- Winter Weather, Europe, 2/23 – 3/2, $1.6 billion, 88 killed
- Severe Weather, Plains, Southeast, Northeast U.S., 3/18 – 3/21, $1.5 billion, 0 killed
- Severe Weather, Rockies, Plains, Midwest, Northeast U.S., 5/12 – 5/16, $1.45 billion, 5 killed
- Winter Weather, China, 1/24 – 1/29, $1.45 billion, 2 killed
- Severe Weather, 7/19 – 7/22, Plains, Midwest, Southeast U.S., $1.43 billion, 18 killed
- Severe Weather, 4/28 – 5/5 Plains, Midwest U.S., $1.4 billion, 0 killed
- Winter Storms Eleanor & Carmen, Western & Central Europe, 1/1 – 1/4, $1.3 billion, 7 killed
- Severe Weather, Plains, Midwest, Southeast, Northeast U.S., 4/13 – 4/17, $1.3 billion, 6 killed
- Drought, South Africa, 1/1 – 5/31, $1.2 billion, 0 killed
- Drought, Australia, 1/1 – 8/1, $1.2 billion, 0 killed
- Severe Weather, 6/3 – 6/7, Plains, Midwest, Southeast U.S., $1.1 billion, 0 killed
- Winter Storm Grayson, Central & Eastern U.S., 1/3 – 1/5, $1.1 billion, 22 killed
- Drought, India, 6/1 – 11/30, $3 billion, 0 killed
- California wildfires, 7/24 – 8/1, $1 billion, 6 killed
- Typhoon Trami, Japan, 9/28 – 10/2, $1 billion, 4 killed


On the verge of an El Niño event
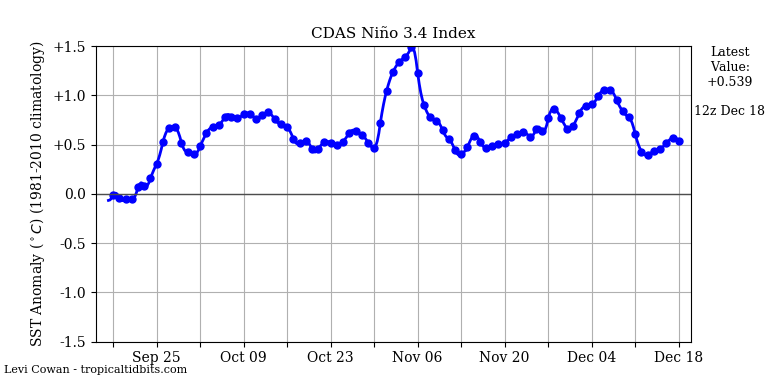
NOAA’s Climate Prediction Center (CPC) kept an El Niño Watch in place in its December 13 monthly advisory, but fell just short of announcing the onset of an El Niño event. Over the past week, sea surface temperatures (SSTs) in the benchmark Niño 3.4 region (in the equatorial Pacific) were about 0.5°C above average. Temperatures of at least 0.5°C above average are needed to be classified as an El Niño event, with the 3-month average temperature staying more than 0.5°C above average for five consecutive months. Oceanic conditions have been above the weak El Niño threshold since late September, but the atmosphere has not yet responded, leading NOAA to classify the current state of the atmosphere as neutral.
Odds for an El Niño event to form were predicted to be 90% for the coming winter (December - January - February), the time of year when El Niño events are typically at their strongest. These odds have increased since the September advisory, when a 65 - 70% chance was given. If an El Niño event does form, it is expected to be a weak one, with a 60% chance of it continuing into spring (March - April - May).
Arctic sea ice: ninth lowest November extent on record
Arctic sea ice extent last month had the ninth lowest average November extent in the 40-year satellite record, according to the National Snow and Ice Data Center (NSIDC).
Notable global heat and cold marks set for November 2018
Hottest temperature in the Northern Hemisphere: 42.0°C (113.2°F) at Matam, Sengal, 5 November
Coldest temperature in the Northern Hemisphere: -55.8°C (-67.4°F) at Summit, Greenland, 29 November
Hottest temperature in the Southern Hemisphere: 45.7°C (114.3°F) at Reobourne Aero, Australia, 18 November
Coldest temperature in the Southern Hemisphere: -59.1°C (-74.4°F) at Dome Fuji, Antarctica, 2 November
(Courtesy of Maximiliano Herrera.)
Major weather stations that set (not tied) new all-time heat or cold records in November 2018
Jakarta Port (Indonesia) max. 37.8°C, 15 November
Kanton Island (Kiribati) max. 35.6°C, 20 November
Proserpine (Australia) max. 44.9°C, 26 November
Mackay (Australia) max. 40.7°C, 26 November
Cairns Airport (Australia) max. 42.6°C, 26 November
Cairns (Australia) max. 43.6°C, 26 November
Innisfail (Australia) max. 42.0°C, 26 November
Low Isles (Australia) max. 38.9°C, 26 November
South Johnstone (Australia) max. 42.2°C, 27 November
Cooktown (Australia) max. 43.9°C, 27 November
Coen (Australia) max. 41.6°C, 27 November
Six all-time national heat records tied or broken in 2018
So far in 2018, six nations have broken or tied an all-time record for hottest temperature in recorded history:
Palau: 95°F (35°C) at Koror on March 22
Algeria: 124.3°F (51.3°C) at Ouargla on July 5
Taiwan: 104.5°F (40.3°C) at Tianxiang on July 10
Japan: 106.0°F (41.1°C) at Kumagaya on July 23
South Korea: 105.8°F (41.0°C) at Hongcheon on August 1
Kiribati: 35.6°C (96.0°F), Kanton Island on November 20 (ties previous record)
No nations have set an all-time cold temperature record so far in 2018. Most nations do not maintain official databases of extreme temperature records, so the national temperature records reported here are in many cases not official. I use as my source for international weather records researcher Maximiliano Herrera, one of the world's top climatologists, who maintains a comprehensive list of extreme temperature records for every nation in the world on his website. If you reproduce this list of extremes, please cite Maximiliano Herrera as the primary source of the weather records.
Fifty-five monthly national/territorial heat records so far in 2018
January: Marshall Islands
February: Marshall Islands, Falkland Islands, Kuwait, Qatar, Saudi Arabia, Palau
March: Marshall Islands, Qatar, Armenia, Madagascar, Pakistan, Iraq, UAE, Turkmenistan, Tajikistan, Uzbekistan, Peru
April: Albania, Montenegro
May: Hong Kong, Norway
June: Oman, Marshall Islands, Cocos Islands
July: Iran, Namibia, Indonesia, El Salvador, Jordan, Luxembourg, Netherlands, South Korea, Comoros
August: Japan, Fiji, Falkland Islands
September: Iraq, Comoros, Myanmar
October: Japan, Finland, Thailand, Switzerland, Guam
November: Hungary, Albania, Slovakia, Poland, Guam, Seychelles, Myanmar
December: Marshall Islands, Japan, Taiwan
(Courtesy of Maximiliano Herrera.)
One national monthly cold record set so far in 2018
September: Iceland
Continental/hemispheric records in 2018
Highest temperature ever recorded in April in Asia: 50.2°C (122.4°F) at Nawabshah, Pakistan, 30 April
World record of the highest reliably-measured minimum temperature in 24 hours: 42.6°C (108.7°F) at Qurayyat, Oman, 26 June
African record of highest temperature: 51.3°C (124.3°F) at Ouargla, Algeria, 5 July
African record of the highest minimum temperature: 39.5°C (103.1°F) at Salah, Algeria, 29 July
Northern Hemisphere record of the highest minimum temperature ever recorded in November: 30.5°C (86.9°F) at Yelimane, Mali, 9 November
Northern Hemisphere record of the highest minimum temperature ever recorded in December: 29.0°C (84.2°F) at Bangkok, Thailand, 4 December
The Weather Company’s primary journalistic mission is to report on breaking weather news, the environment and the importance of science to our lives. This story does not necessarily represent the position of our parent company, IBM.